What's new

Coaster Credits

Nicky Borrill

Strata Poster
I am going to make the move to Excel, finally... Sick of seeing all the cool stats you guys can pull from your spreadsheets.

That being said, the data entry is going to be tedious enough, so I was looking for a head start on the layout and formula coding, by using a template. (Of course I can adapt it and expand it later.)

I found the Coaster101 template here https://www.coaster101.com/2016/11/03/download-coaster101-coaster-counter-template-now/

So far, after a quick play, it seems fairly good. I've adapted it to cover up to 2030 already, entered some dummy data and all 'seems' well.

My questions are, does anybody have any experience with this? and If so, any feedback?

Also, does anybody know of any potentially better ones? I can see that, whilst the amount of data stored is fairly substantial, I'm going to have to create a lot of custom queries to have as much fun as some of you do... (which isn't an issue, again, just being lazy / trying to save time to make the data entry more palatable.)
 
Big One Brian (God bless his soul) had a little black notebook...I tried to get him to stop at ten thousand but he wouldn't listen.
Fun, lazy recording and very quick data entry and retrieval.
Unless you lose your pencil.
 
No experience in using someone else's spreadsheet, unfortunately - mine is custom built from scratch.

My spreadsheet was developed over years and years and fiddling and tweaking. I don't bother with a lot of the specific coaster stats (height, drop, length, etc), generally looking more at "my" statistics. Happy to send you a copy if you're interested. :)
 
Similar to Hixee, mine is my own creation.

I'm adding and tweaking stuff pretty much all the time too. My next step is to play around with things and experiment to be able to produce some nice charts and bits.

Also, I use Google Sheets rather than Excel. There's no major differences between the two that I've really picked up, but I set it up like that when I was having many laptop issues, and meant it was easier to access. It also means I can add entries on my phone if I want (something which I'm sure I could do with Excel if I set things up properly, but probably more of a hassle).

The hardest thing with setting up a spreadsheet for keeping track of things is the initial set up and input of data, and making the early decisions of what and how you want to keep track of things. After that, it's easier to modify and add in things if you want (even if still a bit time consuming at times).

Equally happy to send over mine if you want to see a different set up too! :)
 
Thanks guys, @Hixee I don’t see the point in recording coaster stats like Height Speed etc, as I wouldn’t want to do it for ‘EVERY’ coaster, even if I could find stats for them all, so any averages etc would be skewed.

I’d love to take a look at both of yours, even if I don’t use them, I might steal ideas for adapting my eventual solution further!!!

I have a lot of Excel to learn before I can start running my own queries, it’s just occured to me I only know basic math formulas!!! I don’t even know ‘yet’ how to run a basic ‘if’ condition, or even a ‘for each’ loop in excel!!! Both of which I assume are pretty essential for something like this?
 
I don’t even know ‘yet’ how to run a basic ‘if’ condition, or even a ‘for each’ loop in excel!!! Both of which I assume are pretty essential for something like this?
Being a second-tier software package (I'm sure there's a technical term for this) you generally don't have to worry too much about how exactly to do the hard bit of the coding. You can simply type (in english, not Excel syntax) "count the number of things where this condition is true and also this condition is false" and Excel does the hard bit. Pivot and data tables make some of that processing even easier once you crack the basics.
 
When I made mine, I did a data import straight from my coaster-count ride chronology because all the ride dates were already on there - and sort of ad-hocced the rest.
It helped that I was doing a boring job in a finance office at the time, so I could play with that and still look like I was doing work.

It's not perfect, because I'm still using Excel 2003 for some reason, but it's very functional :)

As an aside, which Nick will appreciate, my 'Doing the 92' football grounds count will go up to 22 later - I wonder if that requires a spreadsheet :)
 
Happy to send you a copy if you're interested. :)

Any chance I could have a look too? I was considering making the move off of Coaster-Count to something more my style and love the idea of all the stats you can pull out!
 
Any chance I could have a look too? I was considering making the move off of Coaster-Count to something more my style and love the idea of all the stats you can pull out!
It is brilliant. I’m going to use it over the 101 one. It fits what I want better.

Somebody could create an official coasterforce template along the lines of the 101 one, but more up to date and with a wider scope than 100 parks and 1000 creds…
 
You can just say "Hixee", you know... ;)

Maybe a 2022 project.

On the one hand, I genuinely did mean anybody... But then, you are perfect for the job :)

It probably doesn't need to output to Python though!!! 🙈🤣

CF branded coaster counting spreadsheet ; will take the world by storm..... :)


There must be a call for it right? There must be other 'lazy' goons who still use CC because they don't want to learn the intricacies of Excel?
 
Last edited:
When I made mine, I did a data import straight from my coaster-count ride chronology because all the ride dates were already on there - and sort of ad-hocced the rest.
It helped that I was doing a boring job in a finance office at the time, so I could play with that and still look like I was doing work.

It's not perfect, because I'm still using Excel 2003 for some reason, but it's very functional :)

As an aside, which Nick will appreciate, my 'Doing the 92' football grounds count will go up to 22 later - I wonder if that requires a spreadsheet :)
It definitely does because it changes each year :)
 
Sorry I'm late to the party on data aggregation - one of my most favorite jams.

Echoing a lot of other folks' approach - I built my own tracker from scratch, nearly 10 years ago. Ironically, I do include coaster stats, as that was the inspiration behind the tracker; a simple question - "Do certain coaster statitistics correlate more highly with my coaster rankings than others?" To be able to calculate this, I did have to incorporate individual coaster statistics, which I've continued the trend on.

To the Google Sheets vs. Excel question - I too went with Google Sheets. This was really in part an experiment to see how much stress I could put on Google Sheets, but also carried ancillary benefit of being easier to share (I have a link to my sheet in my sig: https://docs.google.com/spreadsheets/d/1G0YYtbYE2YgcTyV5sy5X9FmFay2g1Xg_KO0U6NV89H0/edit?usp=sharing), access on phone, and (by complete luck) can easily copy and paste table data from Google Sheets into CF posts, rather than needing to screenshot.
E.g.
Elements Most Preferred
Top Speed1
Height2
Length3
Drop Height4
Year Opened5
Inversions6
Duration7
Cost8

One minor con to going with Google Sheets those years ago was, at the time, Google Sheets did not support tab view. So I do have a large footprint sheet, which can take a few moments to load onto slower computers. As I kept building the spreadsheet, things have definitely led to general sprawl - I do work on a larger computer monitor at home, so not so much an issue, but recognize others might prefer a more tabbed approach.

I recently tried starting in on a new inversion classification effort - that is, recording each unique type of inversion. This is the fun part of building/adapting your own spreadsheet, is you can tinker and play with different questions (such as the recent "how many coaster types are in your top 10" thread), even if you realize unpacking such questions will take months and years to code in. 😅
 
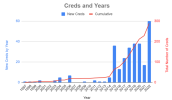
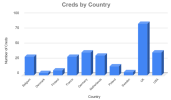
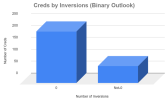
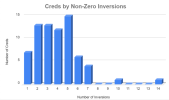
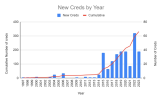
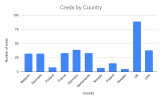
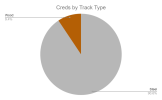
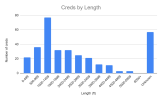
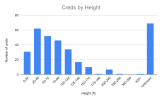
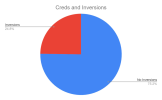
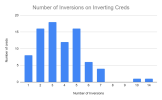
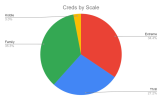
I've been working on updating and fancy-fying my cred sheet a bit lately. Still very much a work in progress, but I finally got round to setting up a couple charts. Here's some sneaky peaks...

1658515011098.png
1658515022346.png
1658515029817.png
1658515036217.png

Still playing about with things and figuring it out...but I'll get there one year...
 
Hi everyone, hope you are all well!

I have long used spreadsheets to note down my coaster credits but I am one of those people who always finds something they don't like so deletes it and starts over. It is a habit of mine that I have until I find something that is perfect. Yes, this means I go through all my credits again and again every time I don't like what I see on my Google Sheet. I just don't know what I want to include. Stats, not stats, location of said ride etc etc. I go over this so many times and never have a spreadsheet ready. Admittedly I only have 152 coasters to record at the moment but down the road it will be much harder to re do everything over and over.

What I want to ask is, how does everyone else collect information in spreadsheets? I would also be very grateful if anyone could give me a glimpse of their own sheet so I can take some inspiration with me ;)

Thank you.
 

I find recording stats (height, speed, length etc.) to be a bit of a waste of time & clutter causing so I don't include those at all. I have been questioned several times on why I include a 'restraint type' column in my ranking but I find that interesting to look at
 
I've been working on updating and fancy-fying my cred sheet a bit lately. Still very much a work in progress, but I finally got round to setting up a couple charts. Here's some sneaky peaks...
I've done some updates to this and have some updated/new charts, which I'm going to share again because why not.

1703876330374.png
1703876345038.png
1703876351849.png
1703876364218.png
1703876370906.png
1703876378792.png
1703876386986.png
1703876394414.png
1703876404603.png

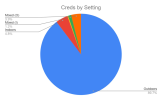
Some new-for-2023 additions have crept into my Cred Sheet too.

Firstly is whether a coaster is indoors or outdoors.
For coasters which are both indoors and outdoors, they're divided into 3 categories:
Mixed (I) - Primarily indoors. Eg: Huracan at Bellewaerde
Mixed (O) - Primarily outdoors. Eg: Thirteen at Alton Towers
Mixed - 50/50ish split. Eg: Flying Dutchman at Efteling
1703876527749.png

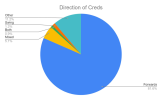
Next is direction of creds.
-Forwards
-Backwards
-Mixed: Runs forwards and backwards (eg: Thirteen at Alton Towers)
-Both: Has run totally forwards and totally backwards and I've ridden in both formats (eg: Swarm at Thorpe Park)
-Swing: Has a swing launch, and that's the only time it has a change of direction (eg: Toutatis at Parc Asterix)
-Other: Spinning coasters
1703876636550.png

Still tweaking and playing with things (want to get to Hyde's level of analysis!), but nice to have some random charts to end the year with.
 
Top