What's new

Top 10(ish): 2024 Edition - page 124

Edward M

Strata Poster
I highly doubt Shellraiser would make my top 25, which is getting very competitive these days!
It did not.

I didn't get on any coasters this year, so, no new additions, just rearranging my previous one (with a few explanations).
  1. Steel Vengeance - *chef's kiss*
  2. Lightning Rod
  3. Helix
  4. Taron
  5. Skyrush
  6. Outlaw Run
  7. X2
  8. Voyage
  9. El Toro - My rides on El Toro in 2019 felt... off. I got off unimpressed and rated it pretty low at the end of last year. However, after my first El Toro-less year since 2017, I find myself missing it more than any other coaster. Call it home park bias, but, even in a year when I didn't get to any new places, I knew I'd at least get to visit Great Adventure for some Toro time. I miss Toro time. ?
  10. Wildfire - Bumped this up above Untamed because it a. has a better start and b. is the most beautiful roller coaster.
  11. Untamed
  12. Fury 325
  13. Boulder Dash
  14. Superman SFNE - Superman's restraint feels like having to put luggage on your lap during a crowded flight.
  15. Maverick
  16. Space Mountain WDW - I will go on the record saying that Space Mountain's two hills have the most underrated ejector out there.
  17. Phoenix
  18. Storm Chaser
  19. Harry Potter and the Escape from Gringotts - I miss theme parks.
  20. Top Thrill Dragster
  21. Shambhala
  22. Kumba - B&M in the 1990s was wildin'.
  23. Millennium Force
  24. Beast - Beast is the avant garde roller coaster. It doesn't make any sense, goes on too long, and seems to be going nowhere at all very fast. Yet, by the end, it builds up to this unique, memorable experience.
  25. Mako
 

Hixee

Flojector
Staff member
Administrator
Moderator
Social Media Team
Not sure when I last posted my Top 20, but to make sure it's included:

1. Steel Vengeance, Cedar Point
2. Lightning Rod, Dollywood
3. Taron, Phantasialand
4. Fury 325, Carowinds
5. Dinoconda, China Dinosaurs Park
6. Boulder Dash, Lake Compounce
7. Skyrush, Hersheypark
8. Voyage, Holiday World
9. Top Thrill Dragster, Cedar Point
10. Helix, Liseberg

11. X2, Six Flags Magic Mountain
12. Wildfire, Kolmarden
13. Montu, Busch Gardens Tampa
14. Untamed, Walibi Holland
15. Nemesis, Alton Towers
16. Storm Chaser, Kentucky Kingdom
17. Formula Rossa, Ferrari World Abu Dhabi
18. Soaring with Dragon, Hefei Wanda Theme Park
19. TRON Lightcycle Power Run, Shanghai Disneyland
20. Wodan Timbur Coaster, Europa Park
 

Matt N

CF Legend
I’ve made a slight rearrangement to my top 10, and while I’m here, I may as well do the top 30:
  1. Mako (SeaWorld Orlando)
  2. Icon (Blackpool Pleasure Beach)
  3. Wicker Man (Alton Towers)
  4. The Swarm (Thorpe Park)
  5. Stealth (Thorpe Park)
  6. Mine Blower (Fun Spot Kissimmee)
  7. Montu (Busch Gardens Tampa)
  8. SheiKra (Busch Gardens Tampa)
  9. Kraken (SeaWorld Orlando)
  10. Rock’n’Rollercoaster (Disney’s Hollywood Studios)
  11. Revenge of the Mummy (Universal Studios Florida)
  12. Harry Potter and the Escape from Gringotts (Universal Studios Florida)
  13. Megafobia (Oakwood)
  14. Incredible Hulk (Universal’s Islands of Adventure)
  15. Rita (Alton Towers)
  16. Oblivion (Alton Towers)
  17. Hollywood Rip Ride Rockit (Universal Studios Florida)
  18. Kumba (Busch Gardens Tampa)
  19. Nemesis Inferno (Thorpe Park)
  20. Cheetah Hunt (Busch Gardens Tampa)
  21. Galactica (Alton Towers)
  22. Avalanche (Blackpool Pleasure Beach)
  23. Slinky Dog Dash (Disney’s Hollywood Studios)
  24. Thirteen (Alton Towers)
  25. Nemesis (Alton Towers)
  26. Expedition Everest (Disney’s Animal Kingdom)
  27. Runaway Mine Train (Alton Towers)
  28. Seven Dwarfs Mine Train (Disney’s Magic Kingdom)
  29. Space Mountain Alpha (Disney’s Magic Kingdom)
  30. Big Thunder Mountain (Disney’s Magic Kingdom)
 

Pokemaniac

Mountain monkey
Staff member
Administrator
Moderator
You wouldn’t believe how long I’ve been putting off finishing my list. Any sense of when such data may or may not be collected, roughly speaking?
I will have a look through the thread some time next week, and count all posts made between November 1, 2019 and October 31, 2020, Norway time. In other words, you've got about 10 hours from now.

Just to include my own top 10 in the list (unchanged since last year since I haven't ridden a coaster since last September):

  1. Helix, Liseberg. No questions asked, this thing is the best coaster I've ridden. Even though it's been a while since I rode it, but hey, if I were to base my Top 10 only on coasters I've ridden in the past couple of years, this would be an awfully short list.
  2. Formula Rossa, Ferrari World Abu Dhabi. A fantastic launch, followed by a terrific sensation of speed that goes on for a decent length of time.
  3. Expedition Everest, Disney's Animal Kingdom. It gets a ton of points for theming, but it's a fairly thrilling coaster in its own right too. The total package is so good it truly deserves a top three spot.
  4. Piraten, Djurs Sommerland. Down from number three in my last list. While I remember it being good, it has been quite a lot of years since I went to Djurs, while my most recent ride on Everest was in 2018. And thinking it over, I don't see how Piraten could top Everest when everything is said and done.
  5. Balder, Liseberg. A great fun, smooth and airtime-filled woodie. It's a wooden coaster done very right.
  6. Nemesis Inferno, Thorpe Park. Stealth used to have this spot, but when I went to Thorpe last year I realized Stealth is a tad too short to be considered the best ride in its park. Second for second, it's really good, but it gets so few seconds to play with. Nemesis Inferno is just long enough, and smooth and snappy too, to nab my favourite spot of the coasters in that park.
  7. Dragon Challenge (post dueling), Universal Studios Islands of Adventure. Counting them together because I rode them back to back and they shared the same footprint and queueline. Two really good and solid Inverts, it's a shame they were torn down. A shame they stopped dueling too, because without it you realize how their layouts made some concessions to get those dueling moments lined up right. So they both meandered a bit. And the area wasn't that well-themed outside of the queue line. Hence why they're below Inferno. Not far below, mind!
  8. Swarm, Thorpe Park. It replaces SpeedMonster in the previous list, because when you think about it, it has the edge over SpeedMonster in all the comparable aspects. Wing riding is fun, it's smooth, the view from the lifthill is great, it has theming, it's not awfully short, and the forces are all right too.
  9. Stealth, Thorpe Park. I said above that Stealth was kicked down a few notches, but it's not outside the Top 10 just yet. It's a very fun ride, but very very short.
  10. Den Aller Minste, TusenFryd. It's the world's tiniest little coaster, what is there not to love? The sheer ridiculousness of its minuscule size gives it just the edge it needs to stand out over other potential top 10 candidates. In a serious list of the best coasters I've ridden, I might have put Lisebergbanan here, but this is about my favourite coasters, so it firmly stays on the list. It gets the number 10 spot, but it stays.
 

FistedColossus

Hyper Poster
Pssst. We may or may not be looking at this top 10 list for our annual CoasterForce top 10, in case you were wondering of updating your latest ranking. ;)
Go on then...

1. Steel Vengeance
2. Skyrush
3. Untamed
4. Hyperion
5. Zadra
6. Taron
7. Magnum XL200
8. Mako
9. Phoenix
10. Maverick

Taron has dropped down a few places after some disappointing rides a couple of weeks ago. Felt a lot more tame than usual perhaps caused by the noticeable rattle? Dunno.

RIP Silver Star, I still think it's underated but can't have it up there with Hyperion. Maverick has slithered in there to take it's place in the top 10.
 

Hyde

Matt SR
Staff member
Moderator
Social Media Team
You wouldn’t believe how long I’ve been putting off finishing my list. Any sense of when such data may or may not be collected, roughly speaking?

btw, been meaning to ask for ages: are you also the Hyde from In the Loop?
If you want to squeak in your top 10 quickly - I can see if I can bargain with the CoasterForce Master Count of our rankings.

And nope, not Andrew Hyde. Just the username I landed on 18 years ago. :p
 

MestnyiGeroi

Giga Poster
If you want to squeak in your top 10 quickly - I can see if I can bargain with the CoasterForce Master Count of our rankings.

I appreciate the offer, but I have too much to do to complete the list, and absolutely no time at the moment to do it. Wouldn’t want anyone waiting for me. I’ll have to wait till next year to improve the CF list with my sage selections.

And nope, not Andrew Hyde. Just the username I landed on 18 years ago. :p

Fair enough. I’m sure you’re the better Hyde. ... Making him the Jekyll ...??
 

MestnyiGeroi

Giga Poster
I will have a look through the thread some time next week, and count all posts made between November 1, 2019 and October 31, 2020, Norway time. In other words, you've got about 10 hours from now.
Thanks for the response. If I still had something like two weeks, I’d make it happen, but I’m not that close. Next year!
Cheers.
 

Hyde

Matt SR
Staff member
Moderator
Social Media Team
Fair enough. I’m sure you’re the better Hyde. ... Making him the Jekyll ...??
hah, indeed the inspiration for my username! I could flip my username to Matt or MSR... but dropping “244” from my username already threw folks for a loop. ?
 

Hutch

Strata Poster
If you want to squeak in your top 10 quickly - I can see if I can bargain with the CoasterForce Master Count of our rankings.
Should've been paying attention to this... I am indeed due for an update. No new creds but a few changes.

1. Steel Vengeance
2. Skyrush
3. Lightning Rod
4. Voyage - Moved up from No. 10... those trimless night rides man. If it was up to the night rides alone, I'd probably put it at No. 1, but the average day rides are still more of a lower Top 10 ride for me. I think 4 is a fair spot.
5. Ravine Flyer II
6. Maverick
7. Storm Chaser - Swapped places with Maverick. Wasn't running as fast as last year (apparently that's been the case all year), but still has some fantastic airtime.
8. Nemesis
9. Phoenix
10. Mako

11. Phantom's Revenge
12. Wicked Cyclone
13. Nitro
14. Mystic Timbers
15. Millennium Force
16. Twisted Cyclone
17. Top Thrill Dragster
18. Goliath
19. Montu
20. Storm Runner

21. Fury 325
22. Lightning Run
23. Fahrenheit
24. Diamondback
25. Superman: The Ride
26. Stealth
27. Intimidator
28. Manta
29. Kumba
30. Thunderbird - Decided to replace Gatekeeper with this, as I finally realized Thunderbird is indeed the better wingrider.
 

Peet

Giga Poster
No change to my top 10 this year. In fact, with just 6 new creds for the year, all dull off-the-shelf jobs, I'd say there's no change to my top 200!
I assume you pick them out of folks' signatures like previous years?
 

Pokemaniac

Mountain monkey
Staff member
Administrator
Moderator
I assume you pick them out of folks' signatures like previous years?
Yes, I do that in addition to those posted directly in posts, but I only collect them from signatures of posts made in this thread between the cutoff dates. So if you have a post from the past year in this thread, your signature should count. If not, I'll collect the list in your signature for next year's ranking from your post here - provided you don't make a newer post in this thread, of course.
 

JoshC.

Strata Poster
What started out as an effort to rank my Top 10% coasters a while back has ended up getting carried away into so much more (I really need to find more to do during Lockdowns)…

(Warning - I got really carried away and did some maths-y stuff in this post. I'll say when that starts and finishes so people can skip over it if you want.. ;))

So here’s my current Top 10% (aka Top 20):
1. Taron
2. Taiga
3. Untamed (Walibi Holland)
4. Helix
5. Oz’Iris
6. Balder
7. Lost Gravity
8. Nemesis
9. Joris en de Draak
10. Troy
11. Goliath (Walibi Holland)
12. Black Mamba
13. Hyperion
14. Lech Coaster
15. Lisbergbanan
16. Van Helsing’s Factory
17. Pulsar
18. The Swarm
19. Nemesis Inferno
20. Colorado Adventure

My rankings are very much based on the philosophy of asking the question “What cred would I most like to ride out of this list?”. It’s not a perfect way of doing it, but it works at this high level.

I then started to wonder if there was any trends with my favourite rides. More specifically, if there was any correlation between how much I enjoy a cred and its stats. So I started have a think and play around with plotting some graphs. But that wasn’t going to be good enough, as it would only show if there was any interesting correlation with my favourite rides.

In the end, I went through and gave a ranking to all my coasters (fortunately 200 isn’t that many). And even then, I didn’t bother ranking the kiddie creds and all the stupid little +1s which wouldn’t really affect my rankings. So that left me with 134 coasters to rank, again with the logic of “Which one would I most like to ride right now?”. Whilst that was fine and a bit more clear cut with my favourites, that was much harder towards the middle and bottom - how do you compare a specific Vekoma looper, Maurer spinner and a woodie all from different countries and decide what you’d rather ride? The short answer is you basically just wing it and hope for the best..! (One day I'll move my Excel spreadsheet onto a Google spreadsheet so I can edit it anywhere, then maybe I can share that list in all its glory...

Then I pulled all the key ride stats (length, height, speed, inversions), which fortunately I track in my cred count sheet. The stats mostly comes from rcdb, unless I think it’s wrong…Untamed’s 270 Double Inverting Corner Stall is 2 inversions, not 1 thank you very much. So far so good.

*Now for some scary-ish maths...*

Now trying to come up with a correlation between several different things is…tricky. Fortunately during my PhD I had to self-teach myself how to use a statistical programming language, R (who says that a Maths PhD doesn’t have real world applications?!). Basically what this would let me do is put in all the data I had, and it would spit out all the possible correlation details I could want. The downside is that I needed complete data for each ride; so the length, height, speed and number of inversions. A fair few had incomplete data, meaning I’d be looking at 110 different coasters and their stats. That leaves a few gaps, but largely it’s okay.

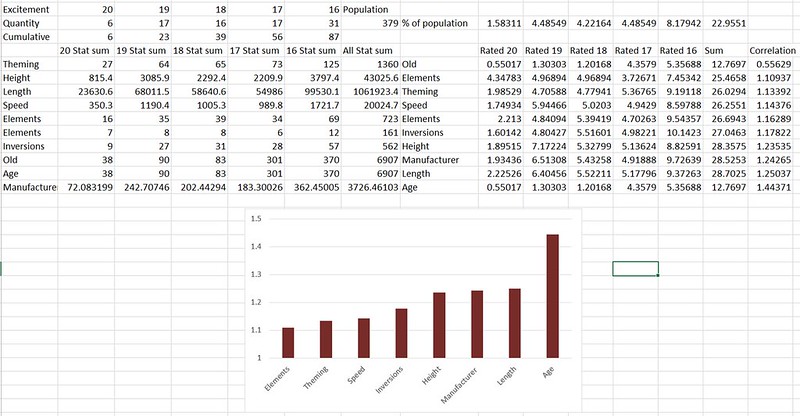
So, putting all that data in and running some magic stats stuff that I don’t really understand properly, I got this lovely graphic:

Rplot03.jpeg
This shows individual correlation between Ranking and each stat, as well as between the stats themselves. The closer the number is to +1, the better the correlation. The closer the number is to -1, the better the “anti-correlation” (basically, the higher the value of the independent variable, the lower the dependent variable). It also gives plots against each variable. So on these individual cases, it seems:

-The longer the length of the cred, the less likely I am to rate it.
-The height of the cred doesn’t matter too much, but I seem to prefer slightly shorter creds
-Creds with higher speeds might detract from the experience for me.
-Number of inversions doesn’t matter too much, but some might help.

There’s issues with this, of course. Most of the creds in this list are in very short range of height (about 80-120ft), and speed (around 40-50mph). This makes it hard to get a good view of any correlations. Equally, number of inversions is a difficult one given its discrete data (0, 1, 2, etc) rather than continuous, and a huge proportion of these creds have no inversions.

But what about combining all these together? Well, R is able to calculate that (though I don’t *really* know how..), and gives a few different measures.

-The first is an adjusted R-squared number (like an R-squared number, but for multiple variables). The closer to 1, the better all the model explain the ranking. This was churned out to be 0.2266, which is low (but in these situations, ie - ones which are less scientific, lower numbers are to be expected).

-We then get a F-statistic value, and a p-value, which are related. The F-statistic’s ‘goodness’ is only seen when compared to another number which comes from the number of pieces of data you have, and the p-value effectively indicates the probability that the F-statistic’s value is wrong. Effectively you want a large F-statistic and a low p-value. The F-statistic is 8.984, which given the size of the data is good, and the p-value is 2.799*10^(-6), which is good.
(NB: I know very little about all this, so I could very much have been talking out my backside during this..)

*End of most of the scary maths stuff*

So basically, what this means is that the model I have (which can be put into an equation; see below) isn’t particularly good at predicting where I’d rank a coaster. But there exists something, perhaps a much more complicated formula, which might be good at such predictions! None of that is too surprising - I'm more likely to like a coaster with good stats after all. But obviously things like theming, location, manufacturer, restraints, etc all come into play too.

So, without further ado, the current formula I have…

Rank = 131.777733 - 0.010833*L + 0.254006*H - 1.607595*S + 4.531214*I
where: L = length in feet, H = height in feet, S = speed in mph, I = inversions
Side note: the stuff which is also churned out from the programming suggest that the current formula puts too much of an incorrect emphasis on height, and that number of inversions is problematic for the formula.

As a random example to show this, this would suggest something like:
Maverick (L=4450, H=105, S=70, I=2) could be my 6th favourite ride, but..
Steel Vengeance (L=5740, H=205, S=74, I=4) might only just squeeze into my Top 20.
Hmmm, maybe not...

Fun fact as well: this formula suggest that a "no-cred" (ie something with no length, height, speed or inversions) would be more fun than my bottom 3 coasters. Those are Ukko at Linnanmaki, as well as MP Express and Condor. Hard to disagree there.. ?

It’ll be interesting to revisit this after riding some new creds, and maybe redoing this whole thing after getting a lot more creds under my belt, to see if I get something which is perhaps better!
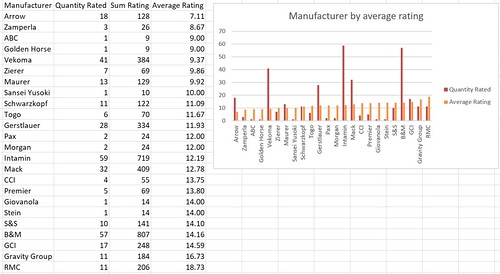
 

HeartlineCoaster

Theme Park Superhero
Some nice work there, I like it.

-The longer the length of the cred, the less likely I am to rate it.
-Creds with higher speeds might detract from the experience for me.
Interesting that you've come to these conclusions, given the prevalence of rides like Taron, Taiga and Helix at the top of your list (all long and fast). I wonder what would happen if you apply some sort of weighting to the rides based on rankings.

The correlation of stats and personal rankings reminded me of some fun @Hyde and I had further back in this topic:


My final results ended up like this (higher number = more correlation):
How new it is: 0.460
Length: 0.400
Speed: 0.383
Height: 0.317
Theming: 0.305
Elements: 0.158
Inversions: -0.015 (who needs 'em)

Might be time for an update myself!
 

JoshC.

Strata Poster
Interesting that you've come to these conclusions, given the prevalence of rides like Taron, Taiga and Helix at the top of your list (all long and fast). I wonder what would happen if you apply some sort of weighting to the rides based on rankings.

Yes, that's a good point. Those conclusions were more solely based on what the numbers were saying, rather than contextualising it with my actual rankings. That's just 'another thing that's wrong that' really (though obviously I didn't say so explicitly). Weighting rankings would be a great thing to do, but tricky.

I also wonder what I think would happen if I could apply some weighting / coefficient based on ride type. Based on my rankings, and based off everything I've seen as well, I'm more likely to rank a multi launch coaster highly for example, but these usually have high speeds and long lengths. That could help further distinguish 'good' long/fast ride, and 'not good' ones.

The correlation of stats and personal rankings reminded me of some fun @Hyde and I had further back in this topic:


My final results ended up like this (higher number = more correlation):


Might be time for an update myself!

Aahhh thanks! I thought that some people had done similar things in the past, but couldn't find it so worried I had dreamt it. Great to be able to compare some similar things. There's so much more I'd love to add - age and duration are big ones. And related to above, I'd love to add some sort of coefficient based on manufacturer too, as I think that really does impact things. Much to think about, and a much deeper rabbit hole to go down...
 

Hyde

Matt SR
Staff member
Moderator
Social Media Team
IS SOMEONE TALKING ABOUT R^2 VALUES AND ROLLER COASTER RANKINGS!?

giphy.gif

Major hats off @JoshC.! Really love the approach and using R <3 (I am currently using R to conduct a spatial economics study for electric vehicle charging stations in a major U.S. city actually!)

As @HeartlineCoaster kindly mentioned, I indeed have been playing with correlations and regressions the last couple of years (my top 10 in my signature actually links to the Google Sheets with the calculations). Here's the link too: https://docs.google.com/spreadsheets/d/1G0YYtbYE2YgcTyV5sy5X9FmFay2g1Xg_KO0U6NV89H0/edit?usp=sharing

But first a quick question @JoshC. just to be sure I'm understanding your work - you were essentially running a regression comparing the various ride statistics against one another, correct?

I ask as my correlations have operated under a slightly different question and philosophy: "is there a specific ride characteristic (e.g. speed, height, length, inversions) that I prefer in roller coasters over others?"

Methodology

To interpret this question, I focused in on each individual statistical column as respective independent variables, and assume the ride's ranking is the dependent variable (that is, if I am ranking roller coasters on the influence of their statistics, that ranking depends on each ride's... well, statistics :p ). The 6 core ride statistics I identified, in part because they are most widely available and accessible:
  • Length​
  • Total Height​
  • Drop Height​
  • Inversion Count​
  • Top Speed​
  • Duration (Time)​
  • Year Opened (Age)​
  • Cost​
So we essentially run individual R Value Correlations for each ride statistic vs. rankings, which would look like this in Excel/Google Sheets: =Correl([Ride Statistic],Ranking)

Calculations


For calculating, I opted for Google Sheets, in part because it has a number of correlation and regression equations already built in, on top of being able to update rankings and create charts under one roof.

Getting down to the brass tacts (which you can find starting around Cell AC132 on the spread sheet), here's how the R Value comparison shakes out of my coaster rankings. As with @JoshC.'s values, the measure of impact here is from 0 to 1: 0 means zero correlation of a statistic to rides' ranking, and 1 means a perfect correlation:

R Value Correlation
CategoryR ValueRank
Top Speed0.701
Height0.612
Length0.553
Drop Height0.514
Year Opened0.425
Inversions0.346
Duration0.287
Cost0.228

Pretty fun returns, which confirm speed, height, and length as the biggest impacts to how I rank a roller coaster, rather than age, ride time, or cost.

BUT WAIT! THERE'S MORE!

Google Sheets has a number of Pearson, Variance, and T-Test functions also built in; basically fun ways to break down data and interpret how actually correct my model is at predicting how I will rank a roller coaster. (Spoiler alert, pretty meh)

Other correlation and regression tests I've run:

Variance - Calculates how widely dispersed data points are from the mean - the higher the value, the greater variability and wider dispersion from the mean:

Variance
Length1,884,219.7
Height3,921.6
Drop4,723.9
Inversions4.6
Top Speed269.8
Duration1,666.3
Year Opened372.4
Cost811,205,935,397,687.0

No surprise Inversions have the smallest variance (since we are almost always in the single digits), where as cost, length, or drop height can vary quite widely.

T-Test - Returns the probability on whether two samples (e.g. Ride Statistic and Ranking) are likely to have come from the same underlying population that have the same mean. TL;DR how relatable are the two samples?

For those in-the-know on statistics, I ran the t-test as a two-tailed distribution, and ran as a two-sample unequal variance (heteroscedastic) test.

TTest
Length0
Height0.334392109
Drop0.001606084587
Inversions0
Top Speed0
Duration0.0007962855871
Year Opened0
Cost0.000001082433071

Eh, not so much. Or at least, it's difficult to prove out length, inversions, and top speed given the wide distribution of types of data.

SteyX - Calculates the standard error of the Ranking, given the Ride Statistic; basically a way we can stress test my model to see how much error there is in it. The higher the value, the better the category is at predicting a ride's ranking:

SteyX
Length49.07
Height46.74
Drop47.70
Inversions55.56
Top Speed42.08
Duration56.58
Year Opened53.43
Cost53.55

These returns are a bit interesting, as ride statistics that are less correlated (e.g. inversion) do a better job at predicting how I will rank a roller coaster. Kind of makes sense, as if I am constantly ranking roller coasters with 0 inversions lowly, for instance - running a SteyX test can identify that characteristic and respective correlation. This is partly due to heteroskedasticity of data, or how widely it can flex from one ride to the next.

Regression to the Mean

Something else worth shouting out that might be of interest @JoshC. is the phenomenon of "Regression Towards the Mean" or the simple concept that the more you measure something, the more likely you are to find a typical "average"; essentially some statistical outliers, but an overall trend of a "typical" roller coaster.

To show you what I mean, I have also worked on creating simple charts to graphically show how ride statistics are dispersed:

Screen Shot 2020-11-18 at 9.24.10 AM.jpgScreen Shot 2020-11-18 at 9.24.02 AM.jpgScreen Shot 2020-11-18 at 9.23.42 AM.jpgScreen Shot 2020-11-18 at 9.24.52 AM.jpg

Across these instances, you'll notice a peak and relative even distribution, tapering off in either end (still working to explain why the height chart was automatically rendered the way it was). Kinda cool to see, and helps show there is a "typical" roller coaster that average amusement parks tend towards when designing their next big ride.

Things I'm Focused on Next

There's a lot more I'd love to do with these ride stats, finding time the last two years has definitely been the challenge:
  • Categorizing Inversions - dude this is a slog. I've actually spent most of my time on this, trying to capture/categorize inversions to run similar comparison and count. There has been an amazing proliferation in inversions over the last 10-15 years however, which makes it really difficult to lump categories together, versus having 20+ inversion types to track.
  • Focusing on Proving Statistical Significance of R Values - A simple task with the right software I haven't had access to since grad school (SAS, SATA, etc.) - you can run more proper tests to prove how statistically significant ride statistics are in predicting rankings. It's a more long-hand form without regression software, such as Google Sheets/Excel that I've been operating in, but something I'd like to get around to.
  • Quantifying Ride Manufacturer, Ride Type, or Other Stats for Consideration - Like @JoshC. mentioned, it's tough to quantify those that are qualifiable. I'm sure there's some dummy variable approach we could use to compare if a roller coaster being a B&M or Gerstlauer impacts our ranking, or ride type specifics; but alas haven't been able to focus on this either.

How this Impacts the CoasterForce Top 10 Rankings

@Pokemaniac and I played with a number of scenarios for rankings when we started doing the CoasterForce rankings back in 2018. Ultimately, we landed on a simple approach of ranking roller coasters based on the average ranking CFers gave roller coasters, and dividing by the number of CFers that rode it (or frequency). Essentially allows us to control for roller coasters that are super highly ranked, but only ridden by 1 or 2 people (those who were around for the Kawasemi Mega Lite debacle in the Mitch Hawker Polls years ago will understand). But to be transparent, we included a number of other ranking methodologies in the tabs, such as taking natural log derivatives or removing outliers: https://docs.google.com/spreadsheets/d/1lCPhr-YEZabub5THt336rXnjHxDnVGCsqoVf0NURjQo/edit?usp=sharing

Thanks for the excuse to update on all the horribly dorky statistics that has also happened under my roof over quarantine. :p
 

JoshC.

Strata Poster
But first a quick question @JoshC. just to be sure I'm understanding your work - you were essentially running a regression comparing the various ride statistics against one another, correct?

I ask as my correlations have operated under a slightly different question and philosophy: "is there a specific ride characteristic (e.g. speed, height, length, inversions) that I prefer in roller coasters over others?"

Essentially yes. I was running a multi linear regression, which to my understanding is a good way to see several variables, when analysed together, have an affect on the dependent variable. And along the way, the R package I use seems to also do normal/single linear regressions too (which is what the image focuses on). That also seems to compare the independent variables too (eg, it shows there's a strong correlation between height and speed).
Full disclosure: I only chose the R package, commands, etc I used because that was I used for my uni stuff, and what I ended up having to teach others to do too. It was very much a "this seems like it could work with creds and ranking, so let's give it a go".

But yes, we have adopted slightly different philosophies. I really liked the idea of trying to come up with a way of predicting ranking, searching for a specific characteristic. But in many ways, to be able to come up with such a prediction, you need to have first determined which characteristics are the most important anyway.


Methodology

To interpret this question, I focused in on each individual statistical column as respective independent variables, and assume the ride's ranking is the dependent variable (that is, if I am ranking roller coasters on the influence of their statistics, that ranking depends on each ride's... well, statistics :p ). The 6 core ride statistics I identified, in part because they are most widely available and accessible:
  • Length​
  • Total Height​
  • Drop Height​
  • Inversion Count​
  • Top Speed​
  • Duration (Time)​
  • Year Opened (Age)​
  • Cost​
So we essentially run individual R Value Correlations for each ride statistic vs. rankings, which would look like this in Excel/Google Sheets: =Correl([Ride Statistic],Ranking)

I'm curious about how you deal with Year Opened / Age. Your ranking doesn't seem to track when you rode them, just when the ride opened. So, in a sense, it's more tracking the time of design, rather than it's age? I think in many ways that could be really revealing if you look at certain periods. But I wonder how the correlation changes as time goes on? Maybe it's not affected as everything is changing linearly? I guess that's one thing which depends on perspective.

I also wonder what the effect on ranking is about the age of the ride is when one rides it. A great example for me is B&M Inverts - I find that they get better with age. But then tracking that becomes a nightmare, because I could ride one when it's 5 years old and give it a ranking of X, but ride it again 10 years later and think it's much better (or obviously with some rides, much worse). But tracking that becomes a nightmare, and raises a lot of other questions.

And thanks for all the other nerdy stats insights @Hyde. I had no clue how much Google Sheets / Excel could do, so it's exciting to see that there's some easier-to-use options too. I'm not familiar with the other software you mentioned for proving the significance of R values though!

It'll be interesting if/when we ever get round to finding a way to include the qualifiable things like manufacturer. Nerdy stuff for the future to compare notes on!
 

HeartlineCoaster

Theme Park Superhero
Quantifying Ride Manufacturer, Ride Type, or Other Stats for Consideration
Challenge accepted.
Provided you have a ranking system in place, the answering of the following questions:
"is there a specific ride characteristic (e.g. speed, height, length, inversions manufacturer) that I prefer in roller coasters over others?"
predicting how I will rank a roller coaster.
Can be as simple as taking averages.
If you already use a scoring system then it could look like this

50620519297_10203ae25b.jpg

With conclusions such as:
1) Yes, I prefer RMCs over others
2) I predict that I will score my next (unique and significant*) B&M a 14 out of 20

*As before, the data I'm using is separate to my overall count, filtered to rides I deem to be unique (no clones) and significant (above an arbitrary size).

If you only have a ranking system in place it depends on how far you've taken it, but it can look like this

50619666613_7bf427f911.jpg

With conclusions such as
1) Yes, I prefer RMCs over others (provided they enter my top 100 at all)
2) Provided it makes my top 100, I predict that I will rank my next B&M in 71st place


I do get that the trickier part is eventually trying to combine manufacturers into the actual question (not one I cheekily reworded)
"is there a specific ride characteristic (e.g. speed, height, length, inversions, manufacturer) that I prefer in roller coasters over others?"
But now I have an average score for each manufacturer I could feed this back into the data as an individual statistic e.g.
Alpengeist has a height of 195ft, 6 inversions and (because it's a B&M) an 'average manufacturer's rating of 14.16'.
Now how much do I care about that?

Here's one I made earlier, but manufacturer now included.

50620495186_7ac416868c_c.jpg


So based on what I would, on average, rate a ride from any given manufacturer, it looks like they are the 3rd most significant factor for me, more important than height and less important than length.


Of course you could then expand on this again and do an analysis of the other stats (height, speed, length), per manufacturer, answering questions like 'how fast do I like my Intamins?' but the size of the data sets will probably end up rather limited. That sounds fun though, brb.
 

Hyde

Matt SR
Staff member
Moderator
Social Media Team
Essentially yes. I was running a multi linear regression, which to my understanding is a good way to see several variables, when analysed together, have an affect on the dependent variable. And along the way, the R package I use seems to also do normal/single linear regressions too (which is what the image focuses on). That also seems to compare the independent variables too (eg, it shows there's a strong correlation between height and speed).
Full disclosure: I only chose the R package, commands, etc I used because that was I used for my uni stuff, and what I ended up having to teach others to do too. It was very much a "this seems like it could work with creds and ranking, so let's give it a go".

Very cool - and I absolutely love R as it's a very versatile open-sourced program. Ironically, I too have calculated linear regressions of various ride statistics against one-another, if only as a footnote to the graphs I created of comparing ride statistics. Notice there is an R^2 value underneath the trendline, which is a feature you can toggle on and off in Google Sheets - pretty handy! But out of interest to align both of our rankings, let me create a linear regression matrix of the various ride stats and report back to compare how similar/different our preferences are!

But yes, we have adopted slightly different philosophies. I really liked the idea of trying to come up with a way of predicting ranking, searching for a specific characteristic. But in many ways, to be able to come up with such a prediction, you need to have first determined which characteristics are the most important anyway.
Likewise! Essentially but making each ride statistic an independent variable, we are simply measuring how correlated they are to my ranking. For instance, if the rides that I like have a higher top speed, then we'll see a far higher positive correlation in the R score than other ride stats.


I'm curious about how you deal with Year Opened / Age. Your ranking doesn't seem to track when you rode them, just when the ride opened. So, in a sense, it's more tracking the time of design, rather than it's age? I think in many ways that could be really revealing if you look at certain periods. But I wonder how the correlation changes as time goes on? Maybe it's not affected as everything is changing linearly? I guess that's one thing which depends on perspective.
Indeed, I don't log year ridden - I had that tracker but it was lost to the Excel gods along the way. I was interested however to both see if there's a correlation to the year a coaster was built, and more openly to see if rides of a certain age can be argued as better than others.

In general, as a rule of thumb, I keep a very open and honest internal dialogue as I ride rides, and am open to shuffling them around. This does yield diminishing returns, as you get to a point where you arguably cannot objectively compare a ride ridden yesterday to one I rode 10 years ago, so I do try to keep that bias in account.

I also wonder what the effect on ranking is about the age of the ride is when one rides it. A great example for me is B&M Inverts - I find that they get better with age. But then tracking that becomes a nightmare, because I could ride one when it's 5 years old and give it a ranking of X, but ride it again 10 years later and think it's much better (or obviously with some rides, much worse). But tracking that becomes a nightmare, and raises a lot of other questions.
Oh my gosh I don't even want to fathom the task of keep that kind of linear tracking lol Indeed that would be an undertaking.

A thought, however - could you simply version your rankings as you go along? That could be one easy way to compare results year-over-year.

And thanks for all the other nerdy stats insights @Hyde. I had no clue how much Google Sheets / Excel could do, so it's exciting to see that there's some easier-to-use options too. I'm not familiar with the other software you mentioned for proving the significance of R values though!

It'll be interesting if/when we ever get round to finding a way to include the qualifiable things like manufacturer. Nerdy stuff for the future to compare notes on!
Likewise so excited to see others doing fun statistical naval gazing! This all started as a simple ranking project in 2014 when I was still in grad school, as I had just lost my ranking list due to harddrive failure and was looking for a cloud-based way to save the data. Indeed Google Sheets has grown by leaps and bounds, Excel has even richer statistical regression equation sets nowadays!

Also love the number crunching @HeartlineCoaster - will follow-up with another response once I can check out your findings! Continuing on in the same post!

Challenge accepted.
Provided you have a ranking system in place, the answering of the following questions:


Can be as simple as taking averages.
If you already use a scoring system then it could look like this

50620519297_10203ae25b.jpg

With conclusions such as:
1) Yes, I prefer RMCs over others
2) I predict that I will score my next (unique and significant*) B&M a 14 out of 20

*As before, the data I'm using is separate to my overall count, filtered to rides I deem to be unique (no clones) and significant (above an arbitrary size).

If you only have a ranking system in place it depends on how far you've taken it, but it can look like this

50619666613_7bf427f911.jpg

With conclusions such as
1) Yes, I prefer RMCs over others (provided they enter my top 100 at all)
2) Provided it makes my top 100, I predict that I will rank my next B&M in 71st place


I do get that the trickier part is eventually trying to combine manufacturers into the actual question (not one I cheekily reworded)

But now I have an average score for each manufacturer I could feed this back into the data as an individual statistic e.g.
Alpengeist has a height of 195ft, 6 inversions and (because it's a B&M) an 'average manufacturer's rating of 14.16'.
Now how much do I care about that?

Here's one I made earlier, but manufacturer now included.

50620495186_7ac416868c_c.jpg


So based on what I would, on average, rate a ride from any given manufacturer, it looks like they are the 3rd most significant factor for me, more important than height and less important than length.


Of course you could then expand on this again and do an analysis of the other stats (height, speed, length), per manufacturer, answering questions like 'how fast do I like my Intamins?' but the size of the data sets will probably end up rather limited. That sounds fun though, brb.
Really good and cool findings @HeartlineCoaster - curious if you could share as a viewable Google sheet, as I'd love to dig in even more. I think you're onto something using the average ranking, if only to create an associated value. I've been thinking more specifically of how you can use a dummy variable, essentially assigning a 0 or 1, but dummy variables really only work well if you're trying to consider one specific element, rather than multiple companies.

Average Ranking of Manufacturers

Good finds on the average rankings of manufacturers too. For fun, I created a quick pivot table to surmise the same - also came up with RMC on top. :) Also threw in Standard Deviation and Variance; with both of these numbers, the lower the number, the more closely ranked roller coasters were. So that's to say not only do RMCs have a high average ranking, but they are closely ranked together, indicating I more highly rank them than, say, B&M; while B&M has relatively high average ranking, a larger standard deviation means I have a wider spread of rankings of B&Ms - some of them very high, some of them very low. Anything that shows a #DIV/0! error means there is only one coaster of that type ranked:


ManufacturerAVERAGE of RankSTDEV of RankVAR of Rank
RMC8.6666666676.0882400337.06666667
Chance30#DIV/0!#DIV/0!
S&S35.521.92031022480.5
GCI51.6363636426.42450653698.2545455
B&M51.7567567627.90500294778.6891892
Gravity Group52.670.613738044986.3
Intamin66.3529411861.581187443792.242647
Giovanola88.56.36396103140.5
International Amusement Devices92#DIV/0!#DIV/0!
Vettel96#DIV/0!#DIV/0!
Morgan102.7565.581374394300.916667
CCI106.428571461.500290363782.285714
Premier107.522.93667171526.0909091
Dynamic Attractions1097.54983443557
Gerstlauer112.166666733.629847851130.966667
Dinn Corp.125.812.19426095148.7
Zierer12676.867851975908.666667
Arrow129.033333348.720514222373.688506
Schwarzkopf129.142857133.869497441147.142857
Dinn130.666666787.20282877604.333333
Philadelphia Toboggan Coasters, Inc.139.633.327332791110.711111
Vekoma148.722222242.552121061810.683007
Reverchon152#DIV/0!#DIV/0!
National Amusement Device Company159.66666671.5275252322.333333333
Zamperla16024.08318916580
Dollywood169.50.70710678120.5
Mack171.142857121.48975393461.8095238
Maurer175.510.60660172112.5
Roller Coaster Corporation of America180#DIV/0!#DIV/0!
Charlie Mach181.54.94974746824.5
E&F Miler Industries183#DIV/0!#DIV/0!
SBF Visa Group183#DIV/0!#DIV/0!
Togo190#DIV/0!#DIV/0!

Crosswise Comparison of Roller Coaster Elements
Reporting back @JoshC. with some preliminary returns on comparing my own rankings of coaster elements against one another. Just as you did in R, I ran as a simple crosswise comparison between elements, creating the table below (also linked in my coaster rankings). I also created a heat map formatting, to call out strong or weak correlations:

Crosswise Comparison.JPG

At a glance, a lot of this makes sense: Drop and Height have a near-perfect correlation (the taller something is, the larger the drop will be). Same with Top speed. One that is interesting is cost, has a negative correlation - I think this is due to some bigger data gaps on not having cost for all rides? But all in, is pretty reflective of correlating ride elements with ranking, and which specific stats seem to have a bigger impression on a roller coaster (e.g. speed, height).
 
Last edited:
Some significant re-jigging here. Since the last update Icon, Tatsu, Nemesis and Troy have all dropped out the top 10.

Icon I feel has got the rawest end of the deal on the drop outs. It's an outstanding ride and I had a stupid amount of fun on Icon this year, but I don't feel my rides were quite as good as the others in my top 10. Not enough insanity to completely satisfy me ?

Tatsu has just suffered from a lack of recent rides, like how do you compare a ride from 10 years ago to something that blew you away this year? Then again, I've still got X2 up there so clearly my memory can still make room for that bat**** insanity. Sorry Tatsu, you've been shifted haha.

Nemesis gave the rides I expected, but I didn't enjoy it quite as much as I have in the past. I think after the life-changing rides on Oblivion on that Octoberfest day, it just couldn't compete.

Troy I must have got on a bad day, but that's no where near my top 10 now. Hopefully i'll be proved wrong on my next visit to Toverland.

Top 10 Coasters
1. Untamed
2. Wildfire (Kolmarden)
3. X2
4. Schwer Des Karnan
5. Shambhala
6. Fluch Von Novgorod
7. Taron
8. Expedition GeForce
9. Fenix
10. Oblivion

Now for the new additions. Schwer Des Karnan, Fluch Von Novgorod, Fenix and Oblivion.

Karnan
and Novgorod. Honestly what can I say about these coasters that isn't already plastered over every online home for enthusiasts. Both coasters are just ridiculous in that they have no right being anywhere near as good as they are. From a manufacturer that has a reputation for it's cloned, repetitive and sometimes rough models, both coasters completely break the norm. Bar X2, they are by far the most unique coasters on that list and every time you ride them you're treated to such an immersive adventure. It's my favourite 1-2 punch of any park i've visited and both just ooze a dark atmosphere in a way that I doubt we'll see replicated on another large scale thrill coaster. Shambhala slots in between the two as I miss that lovely, consistent floater airtime, but Novgorod is dangerously close to taking it's spot. The ball is in your court ShammyB. Better not disappoint on my next visit!

Fenix is a solid coaster, but is also entrenched deep in fond memory too. Just looking at this coaster is one of those "this is why i'm an enthusiast moments". It holds a place in my heart and I can't see that changing anytime soon.

Oblivion. A coaster that i've rode several times over the last couple years and I never really thought of it as more than a one trick pony. Well I don't know what the **** it had for breakfast on the day we visited, but we got hands down the best airtime i've ever experienced in the UK. Our sunset ride was possibly my favourite individual coaster lap of 2020, easily in the top 5. It simply had to go in the top 10 and if I experienced it in exactly the same way again I think it might go up even further.

I really hope that I actually get the cred injection that I was looking for this year in 2021 and I can imagine that list changing quite dramatically again when we reach December next year. A better, more coaster filled year in 2021 please!
 
Last edited:
Top